Parabolas
by Zack Kroll
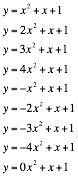
In this exploration we will fix the values for b and c, but vary a when we graph
. What happens to the equation as a varies?

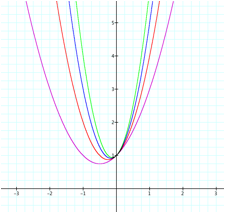
As the value of a increases the graph shrinks horizontally; however, as we can see all four of the graphs open up because a is a positive value. We also notice in these graphs that as the value of a increases from 1 to 4, the minimum value shifts closer toward the y-axis.
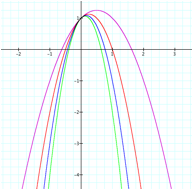
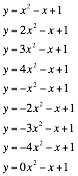
In the case of a < 1, as the |a| increases there is a similar transformation that occurs as when with the previous set of graphs. These graphs open facing down due to the fact that a is negative. We also notice in these graphs that as the value of a decreases from -1 to -4, the maximum shifts closer toward the y-axis. In addition, every graph intersects the y-axis at the point (0,1).
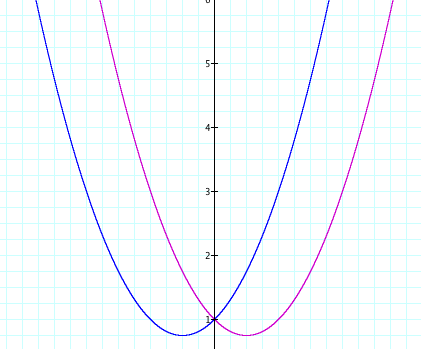
The graphs below (on the left) show what happens when a is manipulated. The graphs not only shrink, but the vertex of each one shifts towards the y-axis (as mentioned above).
The graph on the right displays the changes that can occur by changing the value of b. When b = -1, the size, shape, and orientation of the graph does not seem to be affected. What does occur is a reflection of the parabola over the y-axis. Because of this, the graphs follow the rules of a point reflected over the y-axis: a point (x, y) -> (-x, y).
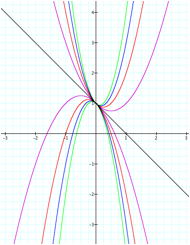
What is the significance of the graph where a = 0? In addition, we can see that when a = 0 the graph becomes a linear function, y = x + 1. This line (y = x + 1) is tangent to all of the other graphs at this point. With the y-intercepts for all of the graphs being (0,1) this is bound to occur.
How does the shape change? How does the position change?
 By changing
the equation from
By changing
the equation from
![]() to
to ![]() size and shape of the graphs stay
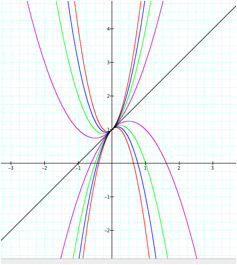
the same, but the position two graphs do not. Upon further inspection we are
able to determine that the original graphs with positive b values and those where b is negative are simply
reflections of one another over the y-axis. We determined this by looking at the vertex of each of the parabolas and comparing them. The vertex of the parabolas in the pink and blue graphs are (0.5, 0.75) and (-0.5, 0.75) respectively.
size and shape of the graphs stay
the same, but the position two graphs do not. Upon further inspection we are
able to determine that the original graphs with positive b values and those where b is negative are simply
reflections of one another over the y-axis. We determined this by looking at the vertex of each of the parabolas and comparing them. The vertex of the parabolas in the pink and blue graphs are (0.5, 0.75) and (-0.5, 0.75) respectively.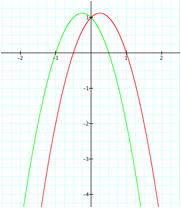 The same can be seen for the graphs of the equations
 ![]() and
and ![]() . Both graphs are reflections of one another over the y-axis. Due to this reflection the vertices of the parabolas have the same y-value, but opposite x-values.
. Both graphs are reflections of one another over the y-axis. Due to this reflection the vertices of the parabolas have the same y-value, but opposite x-values.